SouthBorneoBMWEnthusiasts wrote:
I checked PR from leaderboard. first 'funny' thing is, that all cars start with PR 54.7 instead of 54.6 (according to patch notes). further, it looks like there are small differences between the groups (group 1 with Virgin, Audi, DS and Jag; group 2 with Venturi, Mercedes, BMW and Porsche; group 3 with Penske, NIO, Mahindra and Nissan).
Group 1:
54.7 - 55.0 - 55.3 - 55.6 - 55.8 - 56.1 - 56.4 - 56.7
Group 2:
54.7 - 54.9 - 55.2 - 55.5 - 55.8 - 56.1 - 56.4 - 56.7
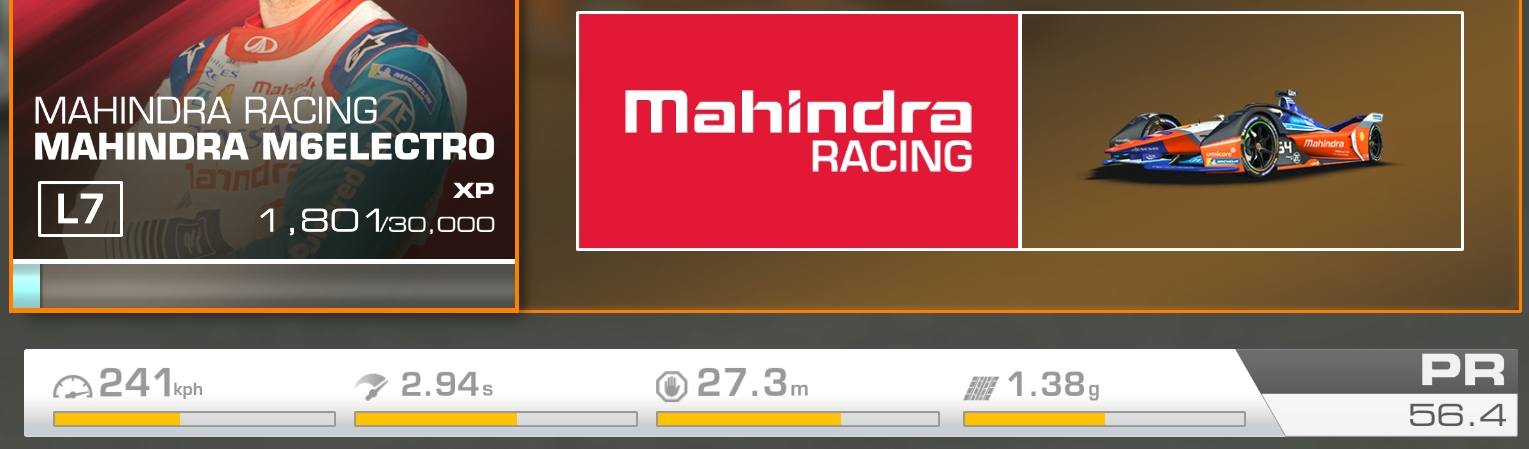
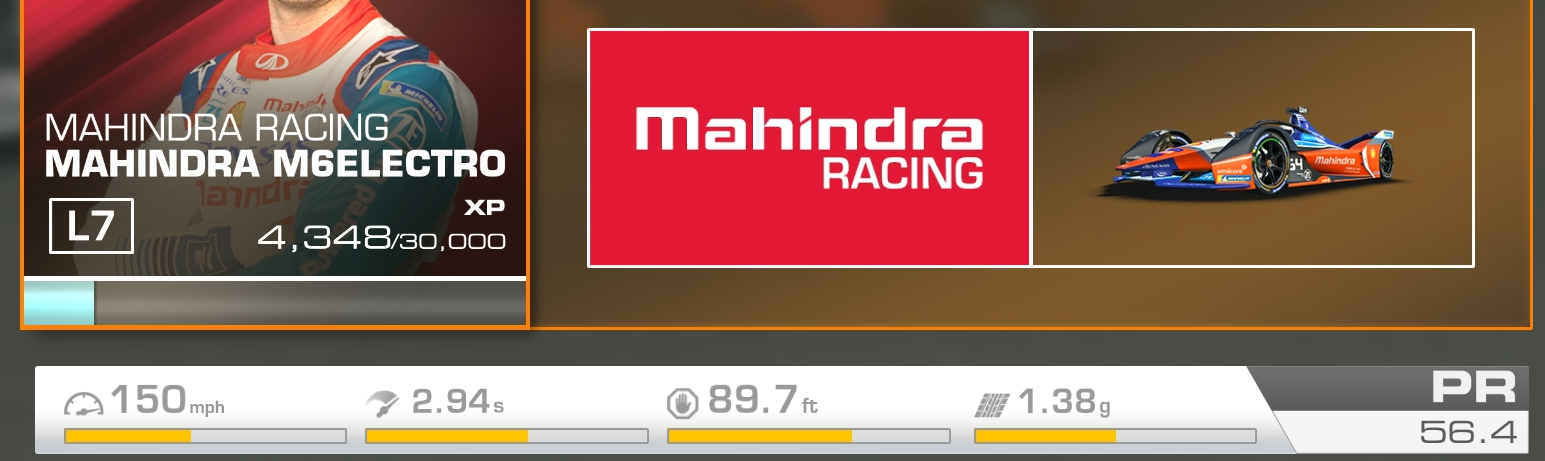
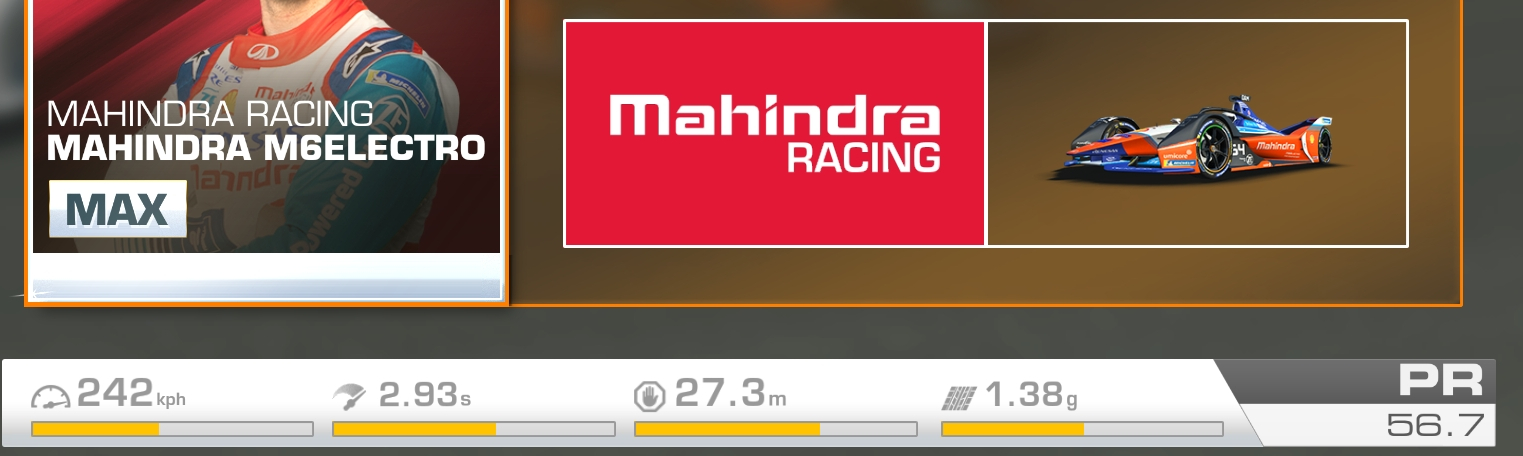
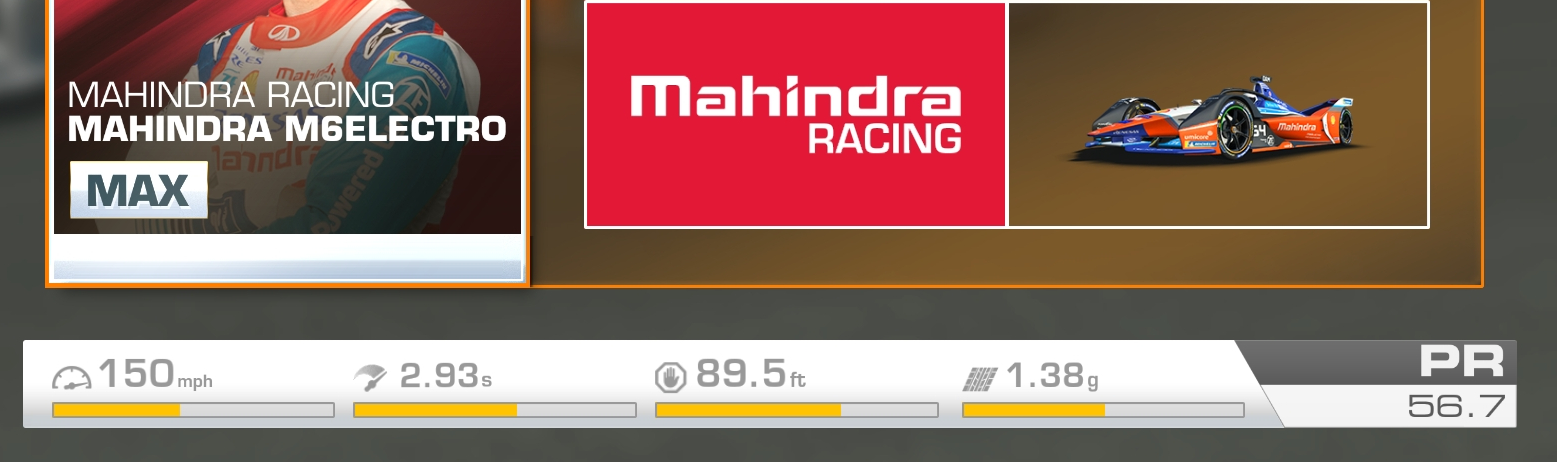
Group 3:
54.7 - 55.0 - 55.2 - 55.5 - 55.8 - 56.1 - 56.4 - 56.7
as mentioned, all data are from the leaderboard, so I just ignored the 55.3 mahindra mentioned above. of course, I might ave made errors, so please check your stats and shout out loud if you observed something different.
otherwise, it looks like group 1 has a (very small) PR advantage over group 3 and group 3 over group 2.
Sorry to ask a question which has probably already been answered many times! Is there a page which shows the groups of cars and explains why some cars are (perceived to be) better than others? Trying to decide which FE car I should go for in the Formula E New York City E-Prix 2020. Thanks.


